Deep Learning Meets ETAS
STATSEI14 · Practical tutorial
Deep Learning Meets ETAS
Practical hybrid workflows for seismic forecasting
This tutorial follows a seismic question through data representation, model choice and evaluation. We introduce the deep-learning building blocks before examining temporal and spatial learning from ETAS, generative aftershock sequences and occurrence classification. The practical applies those modelling decisions to a regional catalogue and an LSTM probability forecast. Prepared spatial and Transformer examples support further exploration.
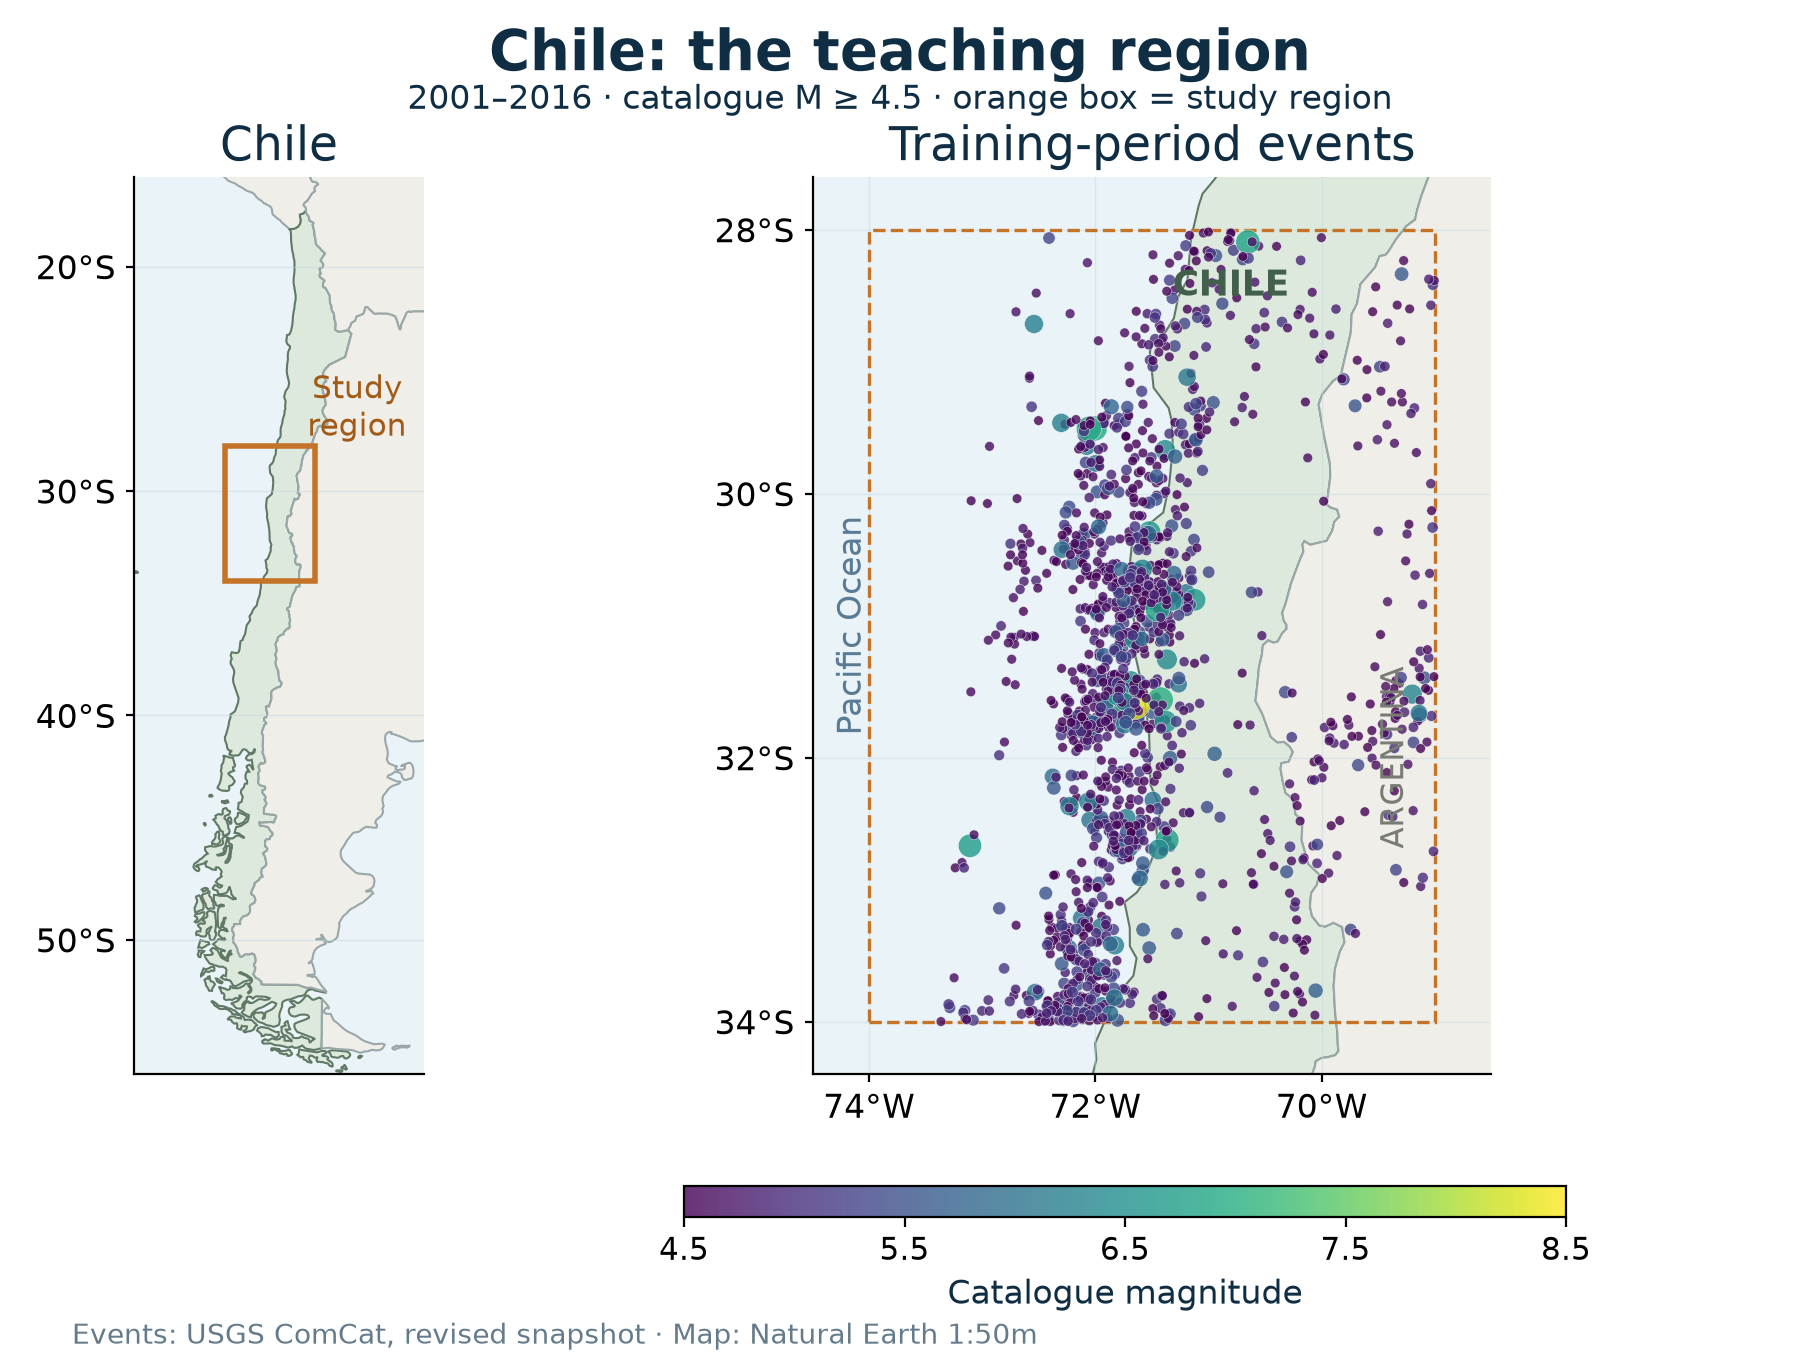
A regional catalogue becomes a sequence of forecasting examples.
Guiding question: How do we turn a seismic question into a deep-learning experiment? In the practical, we estimate the probability of at least one catalogue event with magnitude M ≥ 5 in this region during the next seven days.
What you will be able to do
- Connect a scientific question to a representation, neural architecture, output and loss.
- Distinguish the targets in the Spatial Statistics study, the aftershock work and this practical.
- Locate the study region on a catalogue map, recognize one input window and interpret LSTM probability scores against simple baselines.
- Explain how maps and graphs retain location information, and use the optional examples to explore spatial learning or attention.
- Consider a testable question about representation or modelling through the optional resources in Further exploration.
Before the session
The session welcomes researchers with different levels of Python and deep learning experience. Basic Python helps when running or modifying cells; no previous neural-network training is required. You can also follow the prepared outputs, formulate a hypothesis and interpret the evidence with the group.
Bring a laptop and a browser if you plan to run the code. Download the temporal notebook, open Colab and upload the notebook. Keep the web guide alongside it for explanations and example outputs. The preparation downloads and verifies the frozen catalogue automatically. See Environment and setup for installation and the software used for the supplied results.
What we will explore
Session itinerary
| Section | Guiding question |
|---|---|
| 1. Seismic questions and data | What do we observe, and what do we want to estimate? |
| 2. From data to learning tasks | How do we define inputs, targets and representations? |
| 3. Deep-learning building blocks | How do different models use the available information? |
| 4. Lessons from our research | What worked, what was difficult, and what did we learn? |
| 5. Guided practical | How do we build and evaluate a weekly occurrence forecast? |
MLP, CNN and LSTM illustrate different ways to combine information; adversarial learning introduces generation through two interacting networks. The research cases examine what these capabilities achieved in specific experiments. We connect each scientific question to its representation, model output and evidence, then apply those decisions in the practical.
Guided practical
- Load the catalogue, map the study region and inspect one input example.
- Distinguish learned weights from model settings and read the training protocol.
- Define the references; build, compile, fit and predict with the LSTM.
- Inspect its learning curve, compare probability scores and read calibration with bin counts.
- Contrast regional histories with spatial maps and introduce the Graph + LSTM input and output.
- Discuss one finding and possible research extensions; use prepared Transformer results for an additional comparison if useful.
The guided execution focuses on the regional LSTM. Spatial examples provide a brief contrast, and the complete Graph + LSTM tutorial can be continued in Further exploration. The Transformer, MLP, CNN1D and ETAS-inspired feature experiment remain available as optional comparisons.
Materials to open
- Presentation and PDF.
- Guided temporal example and optional model comparisons, notebook and notebook with example outputs.
- Tutorial pack: temporal, map and graph notebooks, example outputs and frozen data.
- Environment and setup.
Further exploration
These optional resources support questions that attendees may wish to pursue in their own research.
- Further exploration: questions about model capacity and controlled experiments, including a comparison of LSTM states of 8, 16 and 32 units.
- Sensitivity to initialization: compare seeds 7, 17 and 27 under the same protocol.
- Spatial extensions: sequences of maps and the same cells as a graph.
- ETAS-inspired feature experiment.
- Two research examples: constructed illustrations of a temporal window from daily maps and a magnitude-threshold label from a sequence.
- References.
What the experiment can establish
This is a retrospective teaching benchmark using a frozen, revised USGS catalogue. Windows exclude future event times and target intervals cannot cross split boundaries. The downloaded records do not reconstruct the catalogue versions originally available at each historical forecast time.
The ETAS-inspired score is a simplified, truncated triggering feature with illustrative parameters. It is not a fitted ETAS model. An ETAS–GAN combination remains a research proposal, outside the empirical scope of the manuscript discussed and this practical. Neither the course nor a high probability is an operational earthquake warning.